Understanding the Yield Curve provides crucial insights into the health of an economy and anticipates future interest rate movements. This financial tool is often discussed in economic news, yet its complexities can seem daunting. Essentially, the yield curve graphically represents the yields of bonds with equal credit quality but varying maturity dates. It offers a snapshot of market expectations regarding future interest rates and economic activity. Therefore, savvy investors pay close attention to its shape, as it has historically served as a reliable predictor of economic shifts, including recessions.
What is the Yield Curve?
The yield curve plots the interest rates, or yields, of fixed-income securities against their time to maturity. Typically, this refers to government bonds, such as U.S. Treasuries, which are considered highly secure. Bond yields generally reflect the compensation investors demand for lending their money for a specific period. Consequently, these yields are influenced by various factors, including inflation expectations, economic growth forecasts, and monetary policy decisions.
Defining Bonds and Maturities
Bonds are debt instruments where an investor lends money to a borrower, usually a corporation or government, for a defined period. In return, the borrower promises to pay regular interest payments and repay the principal at the maturity date. Maturity dates can range from a few months (short-term) to several years or even decades (long-term). For example, a 3-month Treasury bill is a short-term bond, while a 30-year Treasury bond is a long-term bond. Each bond carries a specific yield, which is the return an investor receives.
Visualizing the Curve
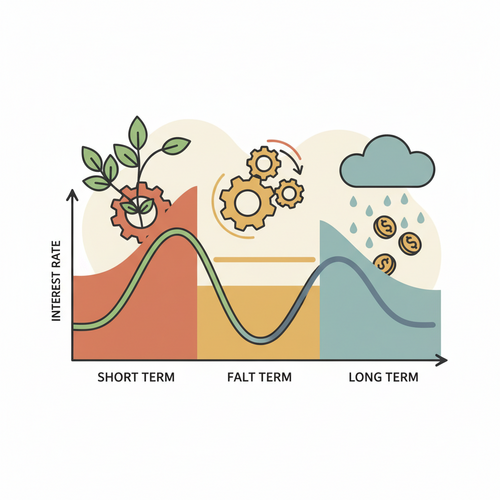
Imagine a graph where the horizontal axis represents the time to maturity (e.g., 3 months, 2 years, 10 years, 30 years). The vertical axis, conversely, shows the yield (interest rate) for each of these maturities. When you connect these points, you create the yield curve. Its slope and shape convey vital information. A rising slope indicates higher yields for longer maturities, while a flatter or inverted slope suggests different market dynamics at play. Consequently, observing these changes helps market participants anticipate future economic conditions.
The Normal Yield Curve: A Healthy Economy’s Signal
A “normal” yield curve slopes upwards from left to right. This means that long-term bonds offer higher yields than short-term bonds. This shape is generally considered a healthy sign for the economy. Investors expect to be compensated more for tying up their money for longer periods. Historically, this configuration suggests stable economic growth and moderate inflation expectations.
Why it Slopes Upwards
Several fundamental reasons explain the upward slope of a normal yield curve. Firstly, long-term bonds carry more interest rate risk. Interest rate fluctuations can significantly impact the value of a long-term bond more than a short-term bond. Therefore, investors demand a higher yield as compensation for this increased risk. Secondly, inflation risk plays a role. Over longer periods, the purchasing power of money can erode due to inflation. Long-term bondholders require a premium to offset this potential loss. Furthermore, investors expect the economy to grow, meaning future short-term interest rates are likely to be higher. This expectation naturally pushes up long-term yields.
Investor Expectations
A normal yield curve reflects market confidence in future economic prosperity. Investors anticipate that the economy will continue to expand, corporate profits will grow, and inflation will remain manageable. Central banks might gradually raise short-term interest rates in such an environment to prevent overheating, but long-term rates rise commensurately. This healthy outlook encourages borrowing and investment, fueling further economic activity. Consequently, a consistently upward-sloping curve often precedes periods of economic expansion.
The Flat Yield Curve: A Sign of Uncertainty
A flat yield curve signifies a narrowing gap between short-term and long-term bond yields. In this scenario, the curve loses its upward slope, becoming relatively horizontal. This shape often emerges during periods of economic transition or uncertainty. It can signal that the market is unsure about the future direction of interest rates and economic growth.
Convergence of Short and Long-Term Yields
When the yield curve flattens, short-term rates rise while long-term rates remain stable or even fall slightly. This convergence often happens when a central bank raises its benchmark short-term interest rates to combat inflation or cool down an overheated economy. Simultaneously, long-term bond investors might anticipate a slowdown in economic growth, leading them to accept lower long-term yields. Therefore, the market discounts future growth prospects. The demand for long-term safe assets increases during times of uncertainty, pushing their yields down. Investopedia provides further details on flat yield curves.
Economic Slowdown Worries
A flat yield curve frequently precedes periods of slower economic growth or even mild recessions. It reflects investor apprehension about future economic performance. The market expects that monetary policy tightening by the central bank will eventually curb economic activity, making long-term investments less attractive. Consequently, businesses may reduce expansion plans, and consumers might become more cautious with spending. This shift in sentiment contributes to the flattening trend. Observing a prolonged period of a flat curve can be a warning sign for investors to reassess their portfolios.
The Inverted Yield Curve: A Potent Recession Indicator
Perhaps the most discussed and often feared shape is the inverted yield curve. This occurs when short-term bond yields surpass long-term bond yields. The curve slopes downwards, which is contrary to the normal expectation. Historically, an inverted yield curve has been an exceptionally reliable predictor of impending economic recessions.
When Short-Term Outpaces Long-Term
An inverted yield curve typically forms when the Federal Reserve or another central bank aggressively raises short-term interest rates to fight inflation. These higher short-term rates make it more expensive for banks to borrow money, translating into higher rates for consumers and businesses. Concurrently, long-term investors become pessimistic about future economic growth. They anticipate that the central bank’s actions will lead to an economic contraction. Consequently, they flock to long-term bonds, seeking safety and locking in current rates before a potential downturn. This increased demand for long-term bonds drives their yields down, pushing them below short-term rates. Reuters offers timely updates and analysis on inverted yield curves.
Historical Precedent and Why it Matters
The inverted yield curve has predicted nearly every U.S. recession since 1955 with remarkable accuracy. While not a guarantee, its track record is significant. The logic is compelling: if investors expect a recession, they anticipate the central bank will eventually cut interest rates to stimulate the economy. Therefore, locking in long-term yields now, even if they are lower than short-term yields, seems attractive because future short-term rates are expected to fall even further. This forward-looking behavior by the bond market makes the inversion such a powerful signal. It reflects a collective market bet against sustained economic growth. For investors, this signal often prompts a shift towards more defensive assets or a reduction in overall market exposure.
Other Shapes and Factors Influencing the Yield Curve
While normal, flat, and inverted are the primary shapes, the yield curve can also exhibit other, less common configurations. Furthermore, various global and domestic factors constantly influence its dynamics.
Humped Yield Curve
A humped yield curve is an unusual shape where medium-term yields are higher than both short-term and long-term yields. This creates a “hump” in the middle of the curve. It suggests that investors expect interest rates to rise in the near term but then decline further out in the future. This can indicate a short-term economic boom followed by a projected slowdown. Such a curve is less frequent but still holds meaning for discerning investors. It often points to specific market inefficiencies or unique economic conditions not captured by the more common shapes.
Role of Central Banks and Inflation
Central banks, like the U.S. Federal Reserve, play a pivotal role in shaping the yield curve, primarily through their control over short-term interest rates. By raising or lowering the federal funds rate, they directly impact the very short end of the curve. Long-term yields, however, are more heavily influenced by market expectations of future inflation and economic growth. High inflation expectations typically push long-term yields upwards, as investors demand more compensation for the erosion of purchasing power. Conversely, subdued inflation expectations can keep long-term yields relatively low. Geopolitical events, commodity prices, and global economic trends also exert significant influence. The Federal Reserve provides comprehensive data and statements on monetary policy.
Interpreting the Yield Curve for Investment Decisions
Understanding the yield curve is not merely an academic exercise; it offers practical guidance for investment strategies. Its signals can help investors position their portfolios to mitigate risks and capitalize on opportunities. However, it should be used in conjunction with other economic indicators.
Long-Term vs. Short-Term Investments
In a normal yield curve environment, investors are rewarded for holding longer-term bonds with higher yields. This makes long-term fixed-income investments more attractive. Conversely, during periods of inversion, short-term bonds offer better returns. This might encourage investors to opt for shorter-duration assets or even cash. Furthermore, equities often perform poorly following an inversion, prompting some to reduce stock exposure. Decisions about portfolio duration become critical when the curve shifts. Active management strategies can benefit from accurately interpreting these signals, adjusting bond allocations accordingly.
Diversification Strategies
Regardless of the yield curve’s shape, diversification remains a cornerstone of sound investment practice. An inverted curve might signal a coming recession, suggesting a move towards defensive stocks, gold, or other safe-haven assets. A flat curve might indicate uncertainty, prompting a more balanced approach between growth and value investments. Always consider your individual financial goals and risk tolerance. Consulting a financial advisor can provide personalized insights based on yield curve analysis and broader market conditions. Bloomberg Markets offers real-time bond and rate data.
Conclusion
The yield curve stands as a remarkably insightful economic indicator, offering a clear visual representation of market expectations for future interest rates and economic health. Its various shapes—normal, flat, and inverted—each carry distinct messages. A normal, upward-sloping curve generally signals economic expansion. Conversely, a flat curve suggests caution and potential slowdowns, while an inverted curve has historically served as a potent harbinger of recessions. By diligently monitoring the yield curve’s movements and understanding the underlying factors that influence it, investors can gain a significant edge. This knowledge empowers them to make more informed decisions, adapting their investment strategies to navigate the ever-changing landscape of financial markets. Consequently, integrating yield curve analysis into your broader economic outlook can be a valuable asset for any astute investor, enhancing your ability to anticipate and respond to market shifts effectively. Continuous education about these sophisticated tools will undoubtedly improve your financial literacy.